Purpose
The purpose of this document is to provide information surrounding the functionality and use of the ‘Diagnostics and Tools’ tab within PC-Doctor Service Center.
Description
Within the PC-Doctor Service Center UI the ‘Diagnostics and Tools’ tab provides primary access to running ad hoc diagnostics and accessing any relevant systems tools (bottom bar). Launching diagnostics via this method is detailed below.
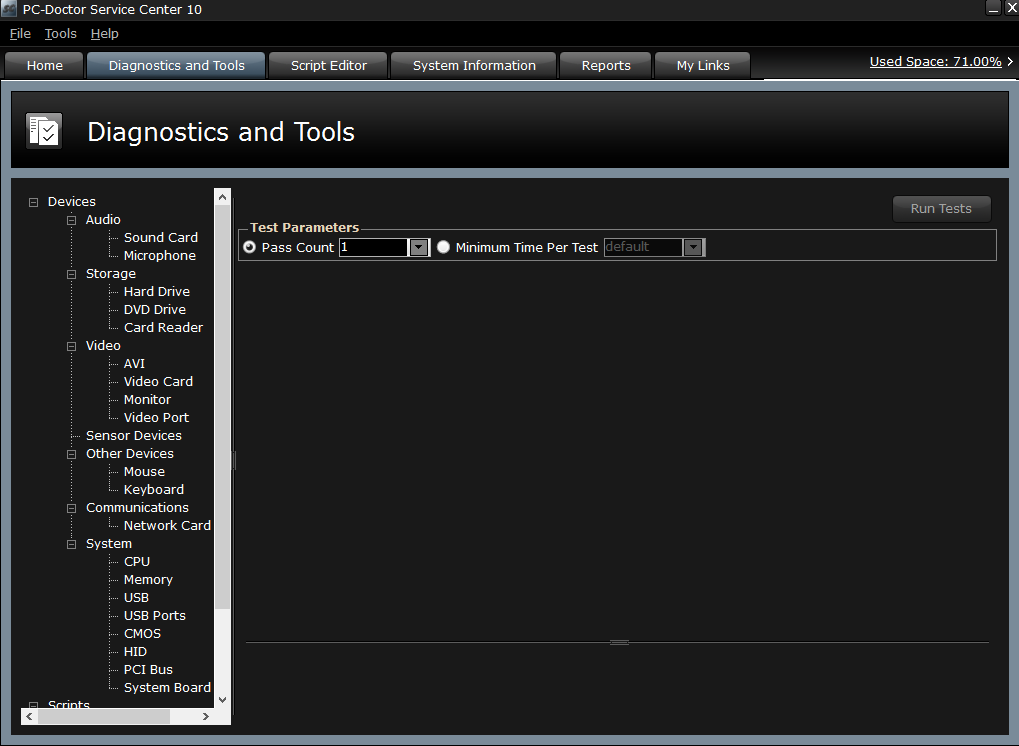
- Upon launching Service Center and selecting the “Diagnostics and Tools’ tab, you will see the following screen. The left side will contain the list of diagnostics and right side will be empty as seen below:
- Within the left pane, you have three options to choose which diagnostics to run:
Category (Ex: Audio, Storage): All PC-Doctor diagnostics are categorized for easy navigation.
Device Type (Ex: Sound Card, Microphone, Hard Drive): All PC-Doctor diagnostics are associated to specific devices.
Script (Ex: System Test): The five default scripts are also included here. - Once you have selected one of the three options, the right pane will update all the appropriate diagnostics. For example, if you select ‘Hard Drive’, you will see a screen similar to the one below:
Note: The available tests may differ depending on the hardware configuration of the machine being tested.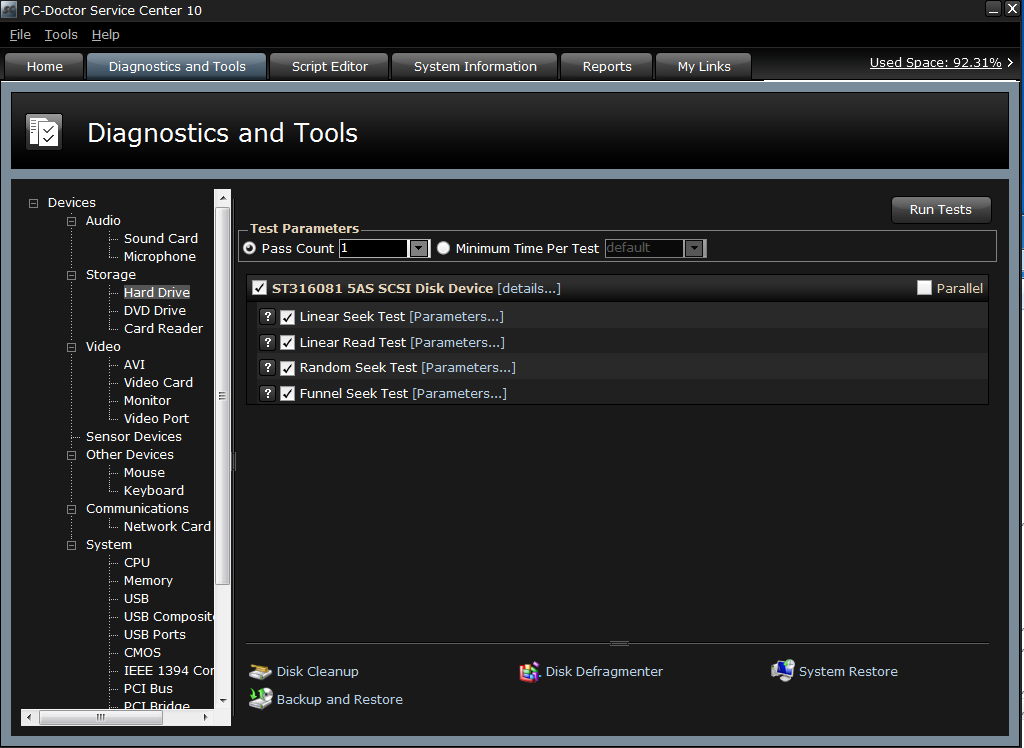
- The right pane is then used to run the diagnostics with some additional options available for fine tuning and links to common system tools as annotated in the screenshot and descriptions below:
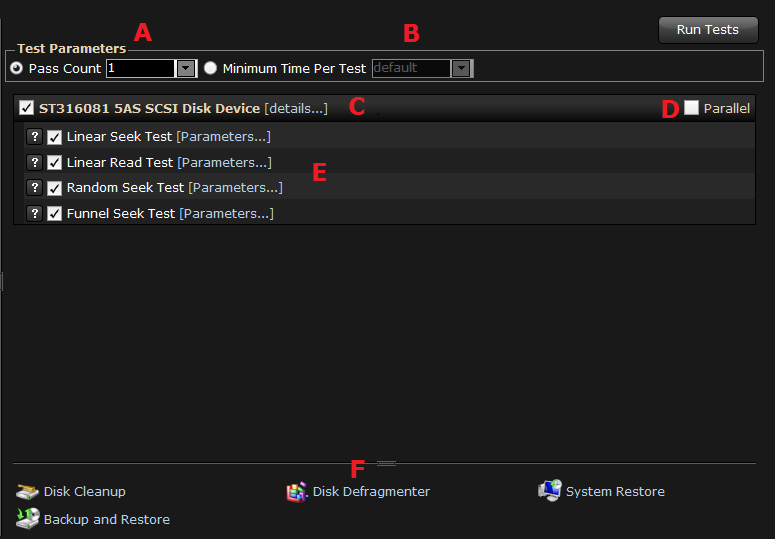
- Pass Count: Choose the radio button and select a value from the dropdown. By default, all chosen diagnostics will be executed once, however, increasing this value will cause the diagnostic to repeat for the allocated number of passes.
- Minimum Time Per Test: Choose this radio button and select a value from the dropdown menu. By default, all diagnostics will take the least amount of time possible to finish their test algorithm. Altering the value from ‘default’ will cause each diagnostic to run for at least the specified amount of time. If the diagnostic finishes its test algorithm before the specified time, it will repeat itself. This option is typically used in burn-in or stress testing.
- The device to be tested is shown. Clicking on the checkbox will select all related diagnostics for that device. Clicking on ‘details…’ will show the available system information for the device.
- If there are multiple devices to be tested, this checkbox can be selected to test all of the devices in parallel.
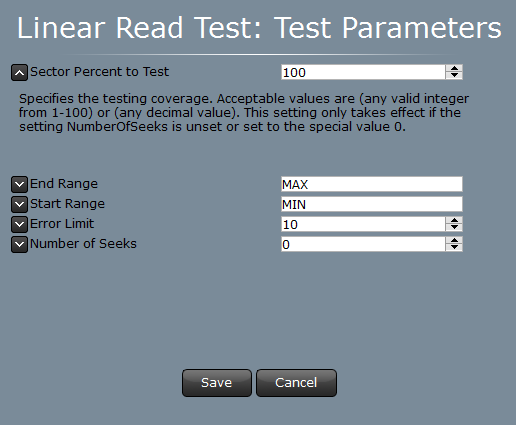
- Each individual diagnostic is shown in the list on the selected category, device, or script. All diagnostics have a little help icon that will provide a description. Some diagnostics include parameters to further fine tune the diagnostic. For example, you may customize the ‘Linear Read Test’. The default value and a description of each parameter is shown to guide you in selecting the best option. An example of these parameters can be seen below:
- The bottom pane displays links to commonly used system tools available for each device or category.
- Click the ‘Run Tests’ button to commence testing. Diagnostics run in real time in the order listed.